Design Brief
In 2018, the research team at NWEA released the results of a study on Evaluating the Relationships Between Poverty and School Performance. This 15-page report reveals that while academic achievement and poverty are closely correlated, growth is less so, with many “low performing” schools exhibiting above-average growth.
Lending my time to the NWEA Creative Services team, I was handed the report and asked to create an infographic that would make the key findings easily digestible to parents, educators, and even policymakers.
Process
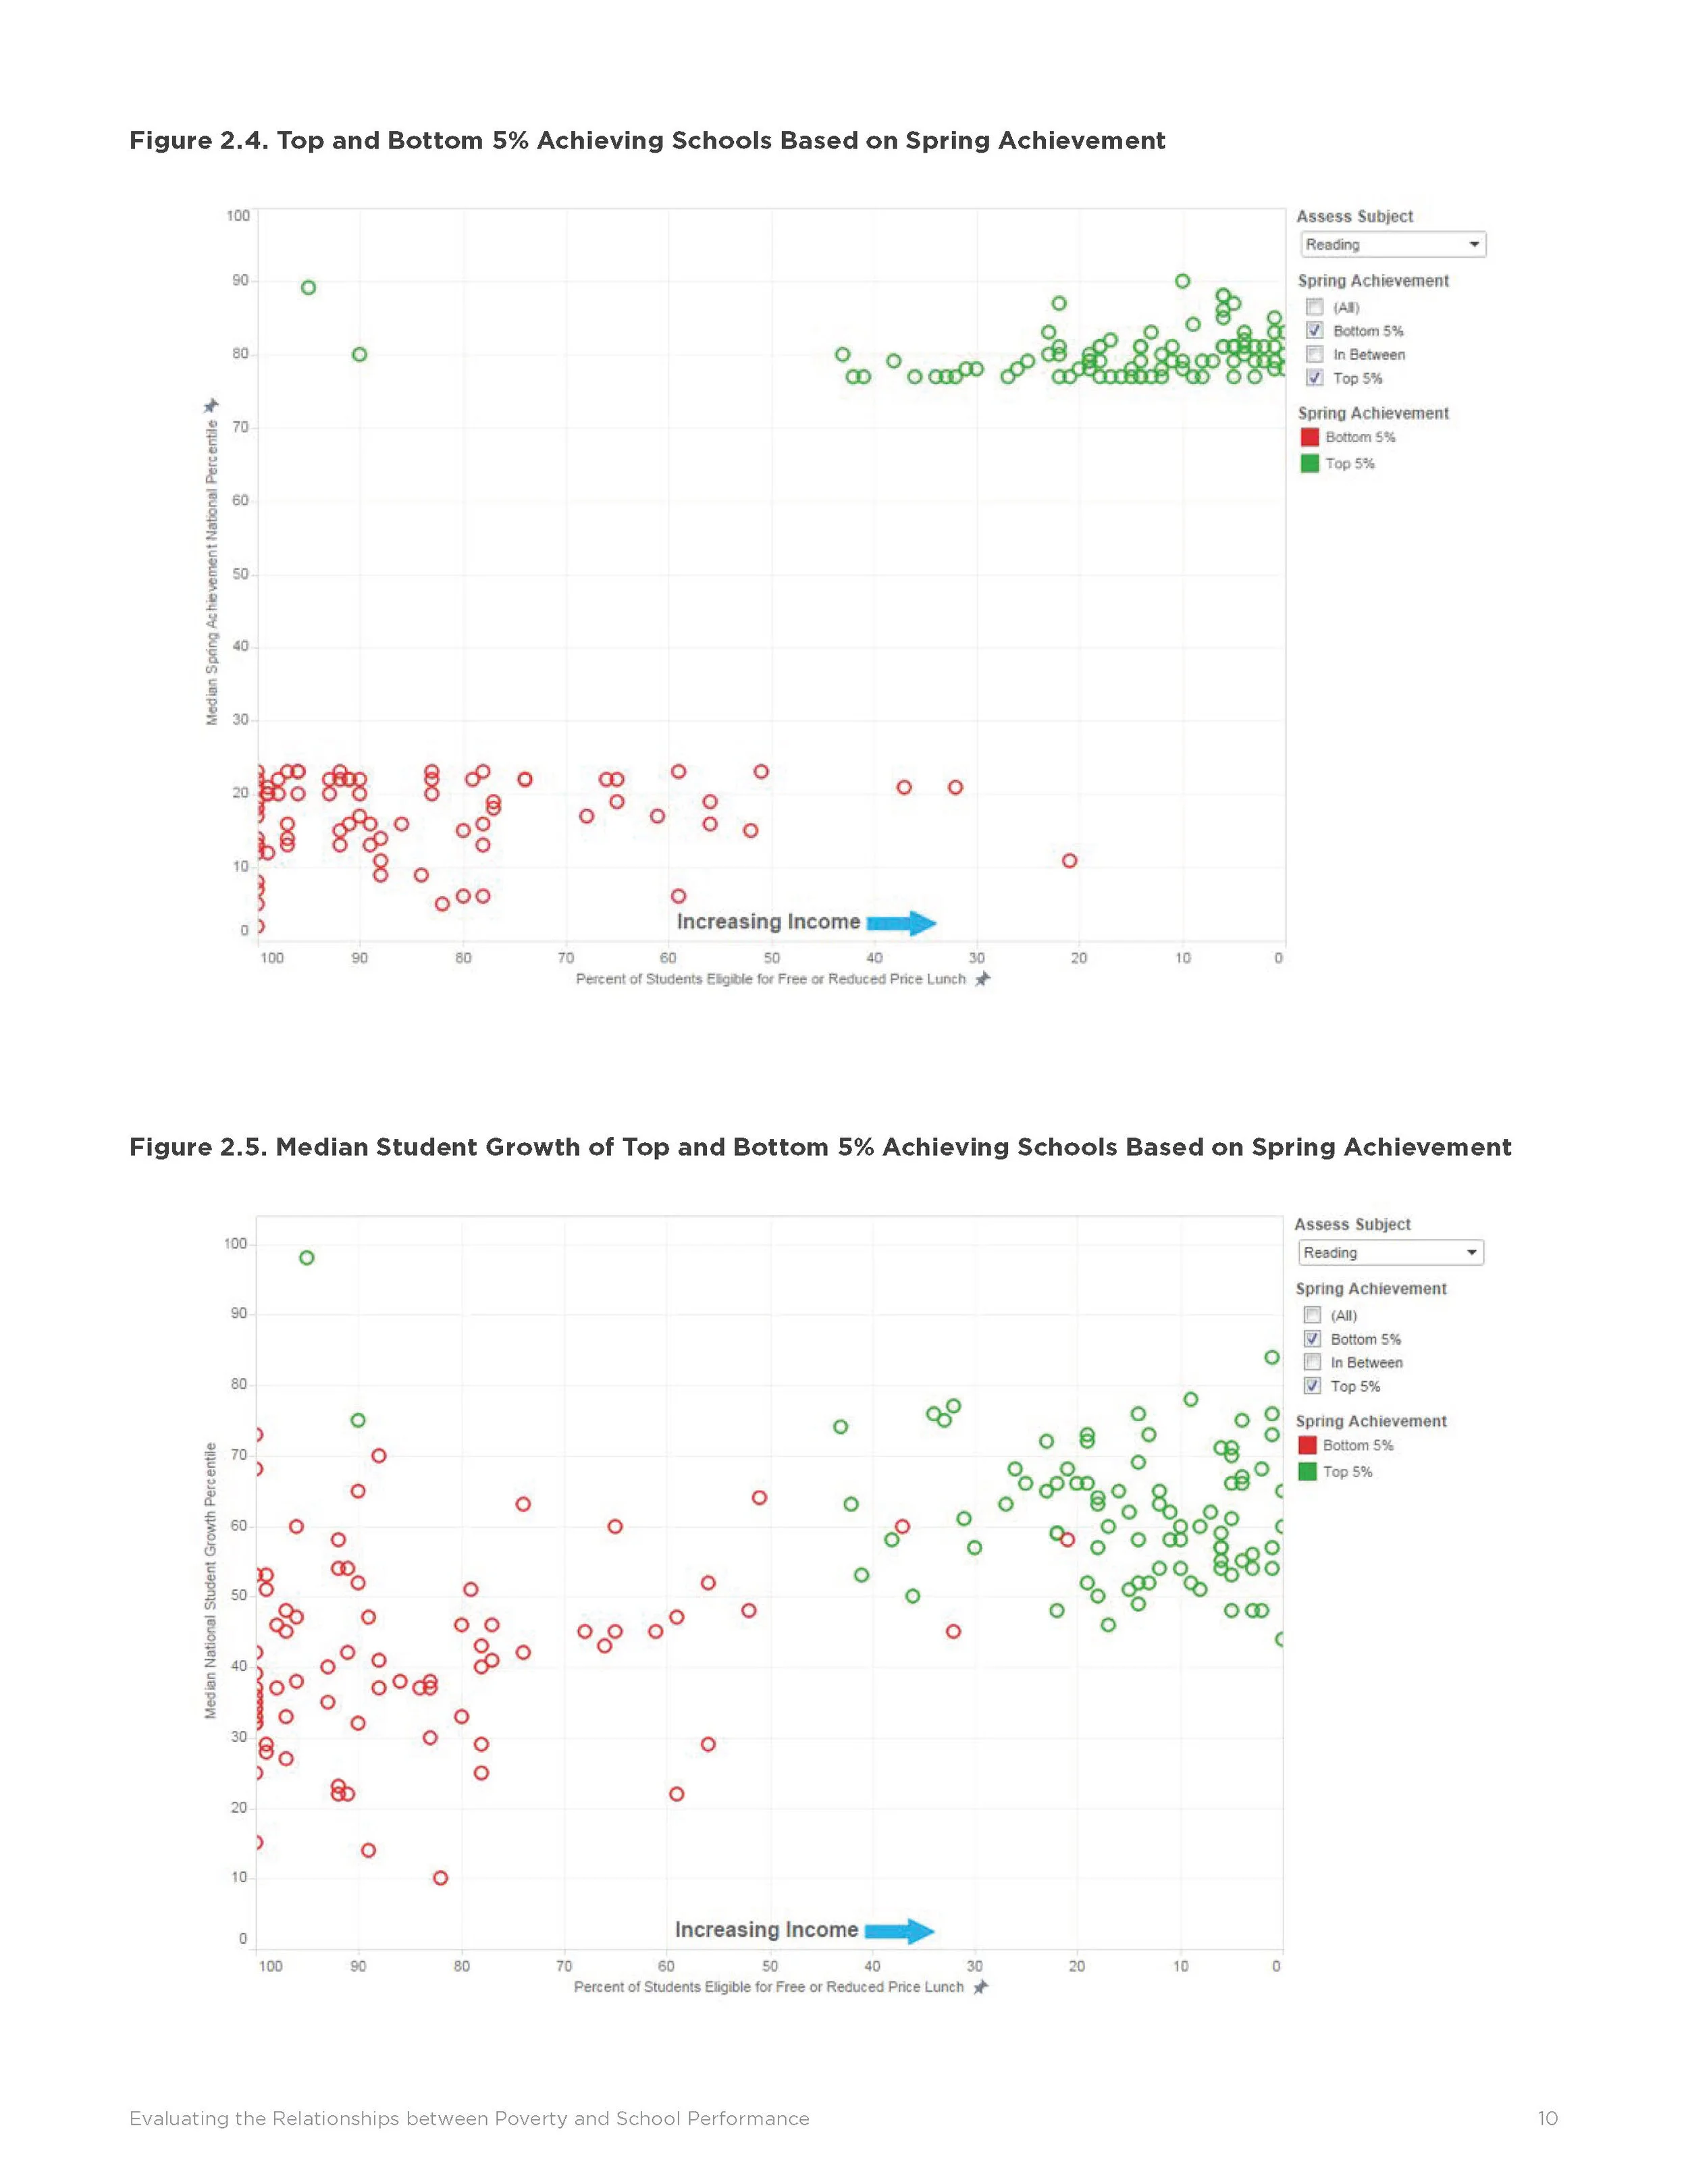
I deeply familiarized myself with the report, extracting key findings to highlight for readers. Example pages of the report are shown in the gallery below (or view the full document here). You may notice that the writing and corresponding figures can be difficult for non-researchers to interpret.
Report pages and figures


Early sketches
I created a diverse range of initial digital sketches visualizing key data points and concepts from the report.


Final infographic design
The final design showcases original copy and illustrations from yours truly. Click through to see the full infographic without annotations!

Animated video
The NWEA marketing team took the concept a step further, working with a professional animator to create this video based on the infographic.
Animated video by Byron Titus